
The context
Official inflation figures arrive weeks after the period they describe. Truflation, a Hong Kong-based Web3 company, set out to close that gap with a daily inflation rate calculated from millions of data points and real-world transactions, stored on-chain and offered to the wider community.
In 2022, Truflation engaged Butter to help design, build and operate its digital products: a real-time dashboard and a marketing website.
The challenge
Three things made the project difficult.
The timeline was short. Truflation wanted to launch in time for a convention, which fixed the date.
The data had to be handled well. Butter had to plug into Truflation's data structure and make sure processing was efficient and fast.
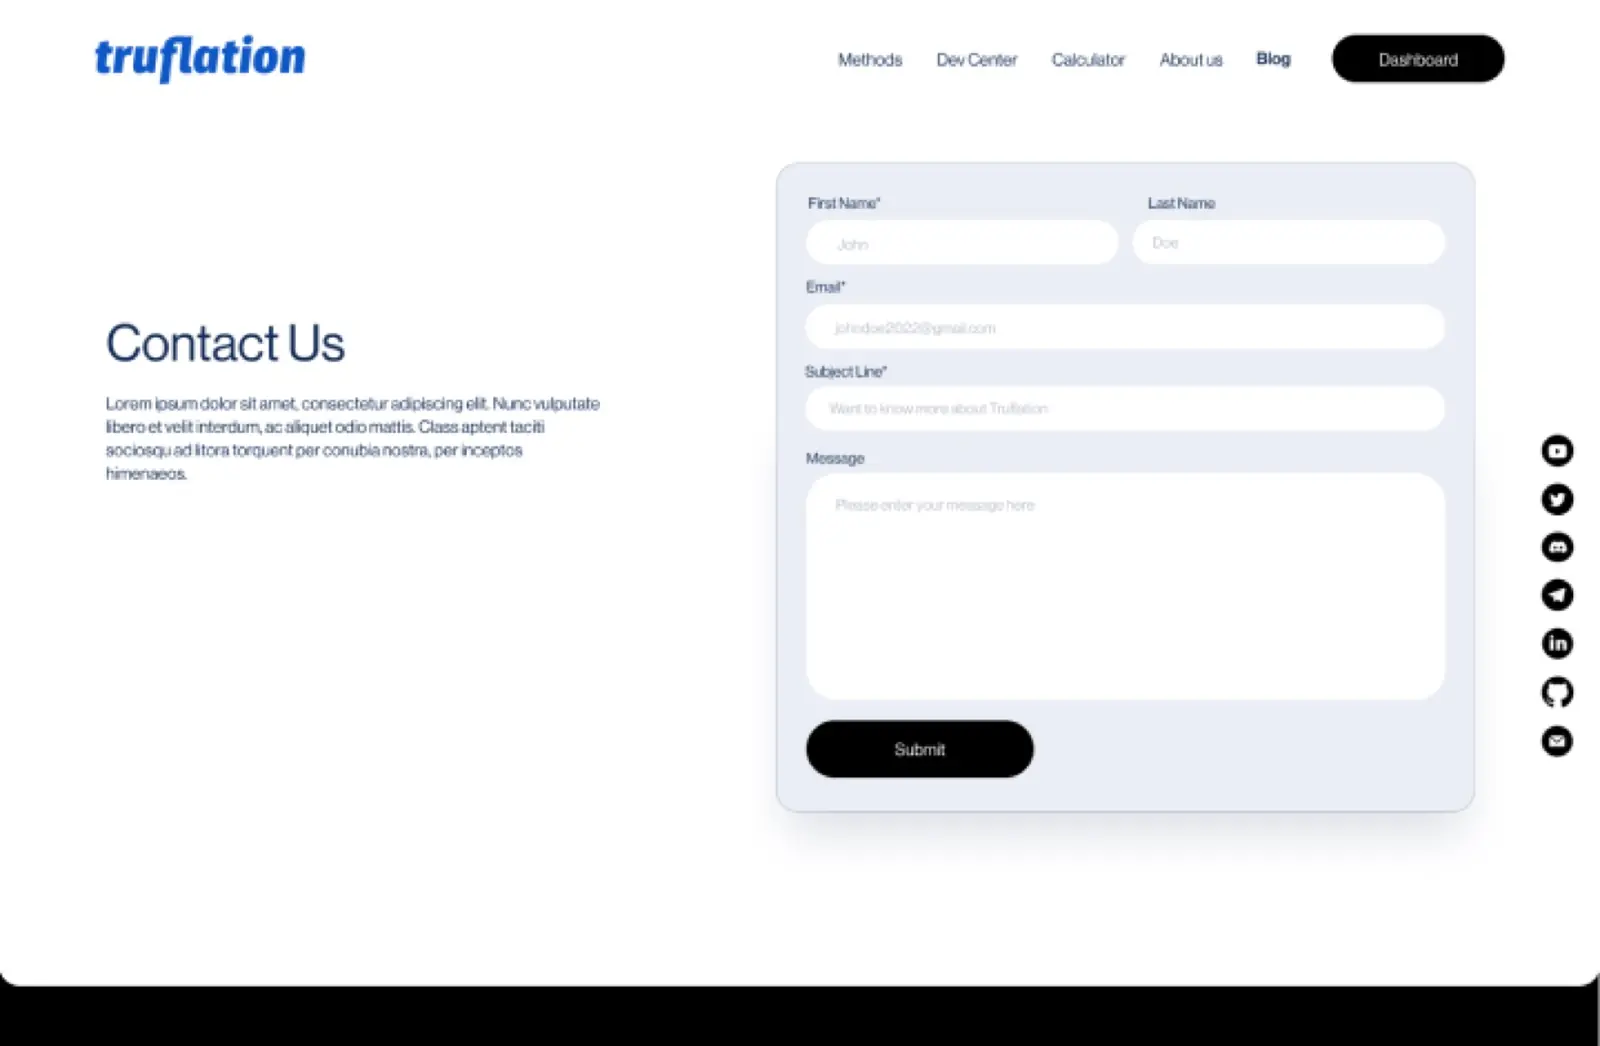
And there were two products, not one. The marketing website and the dashboard had to work independently and in unison. The dashboard needed to hold its own as a stand-alone application while sharing the website's identity. Truflation also wanted design guidelines to give the brand a consistent identity online, and an interface professional enough to be trusted.
The approach
Butter gave the two products one identity and two technical foundations.
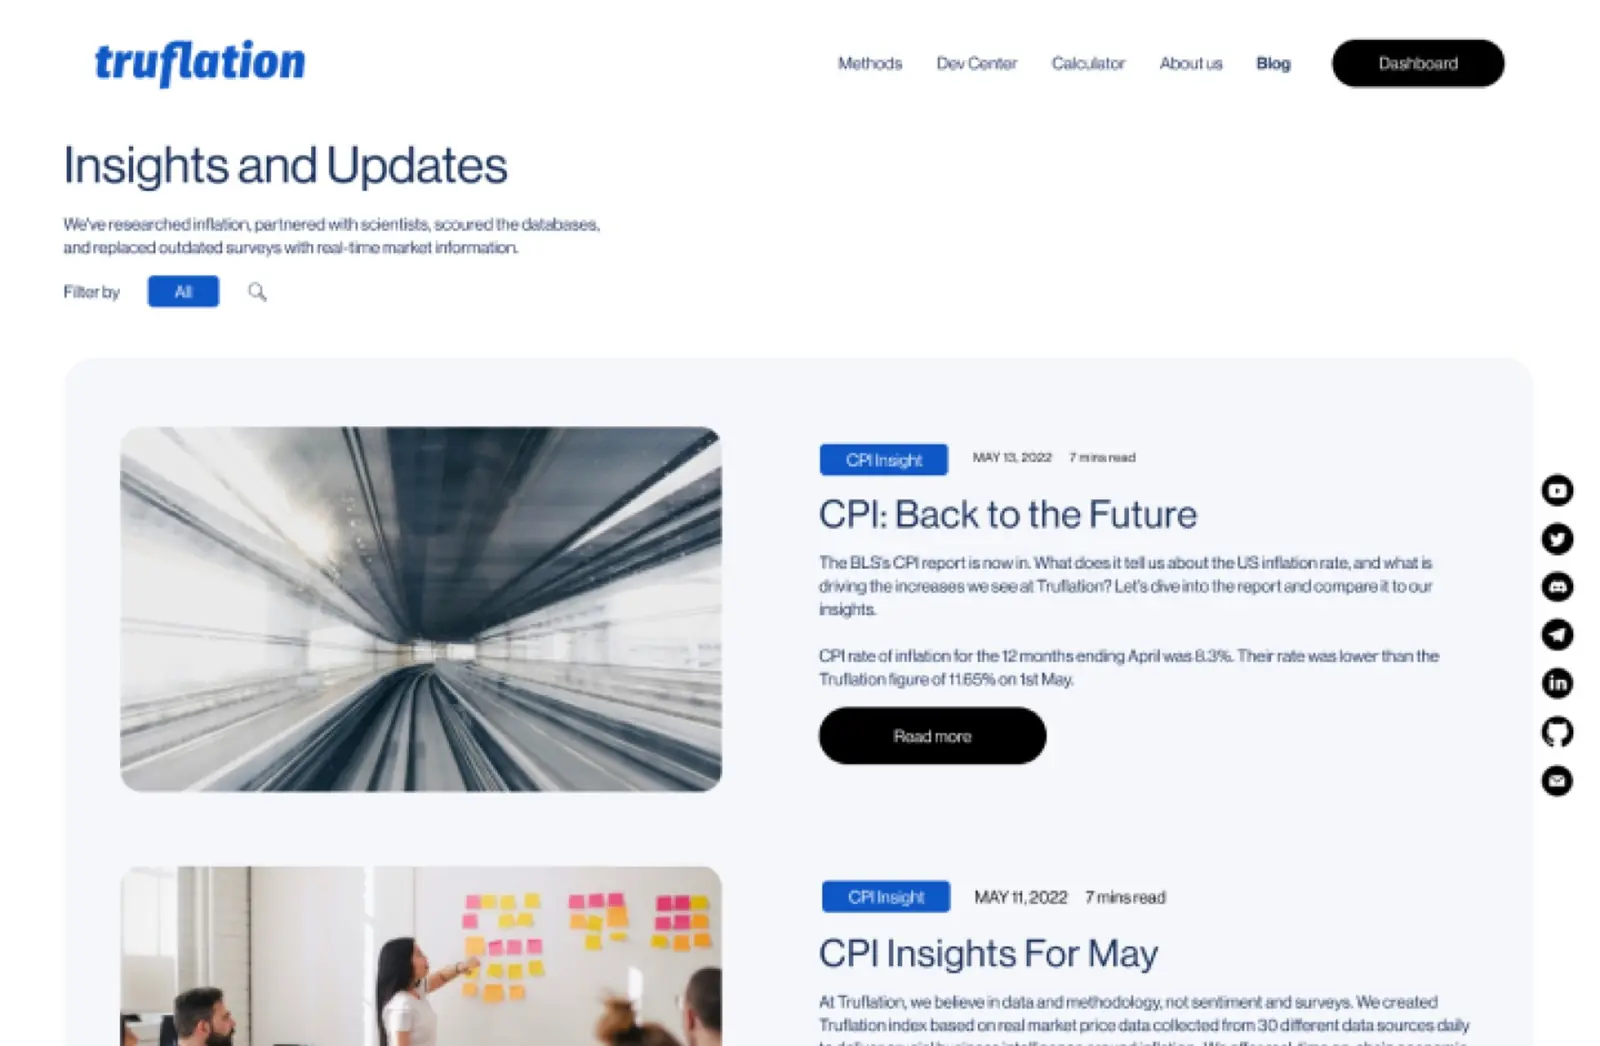
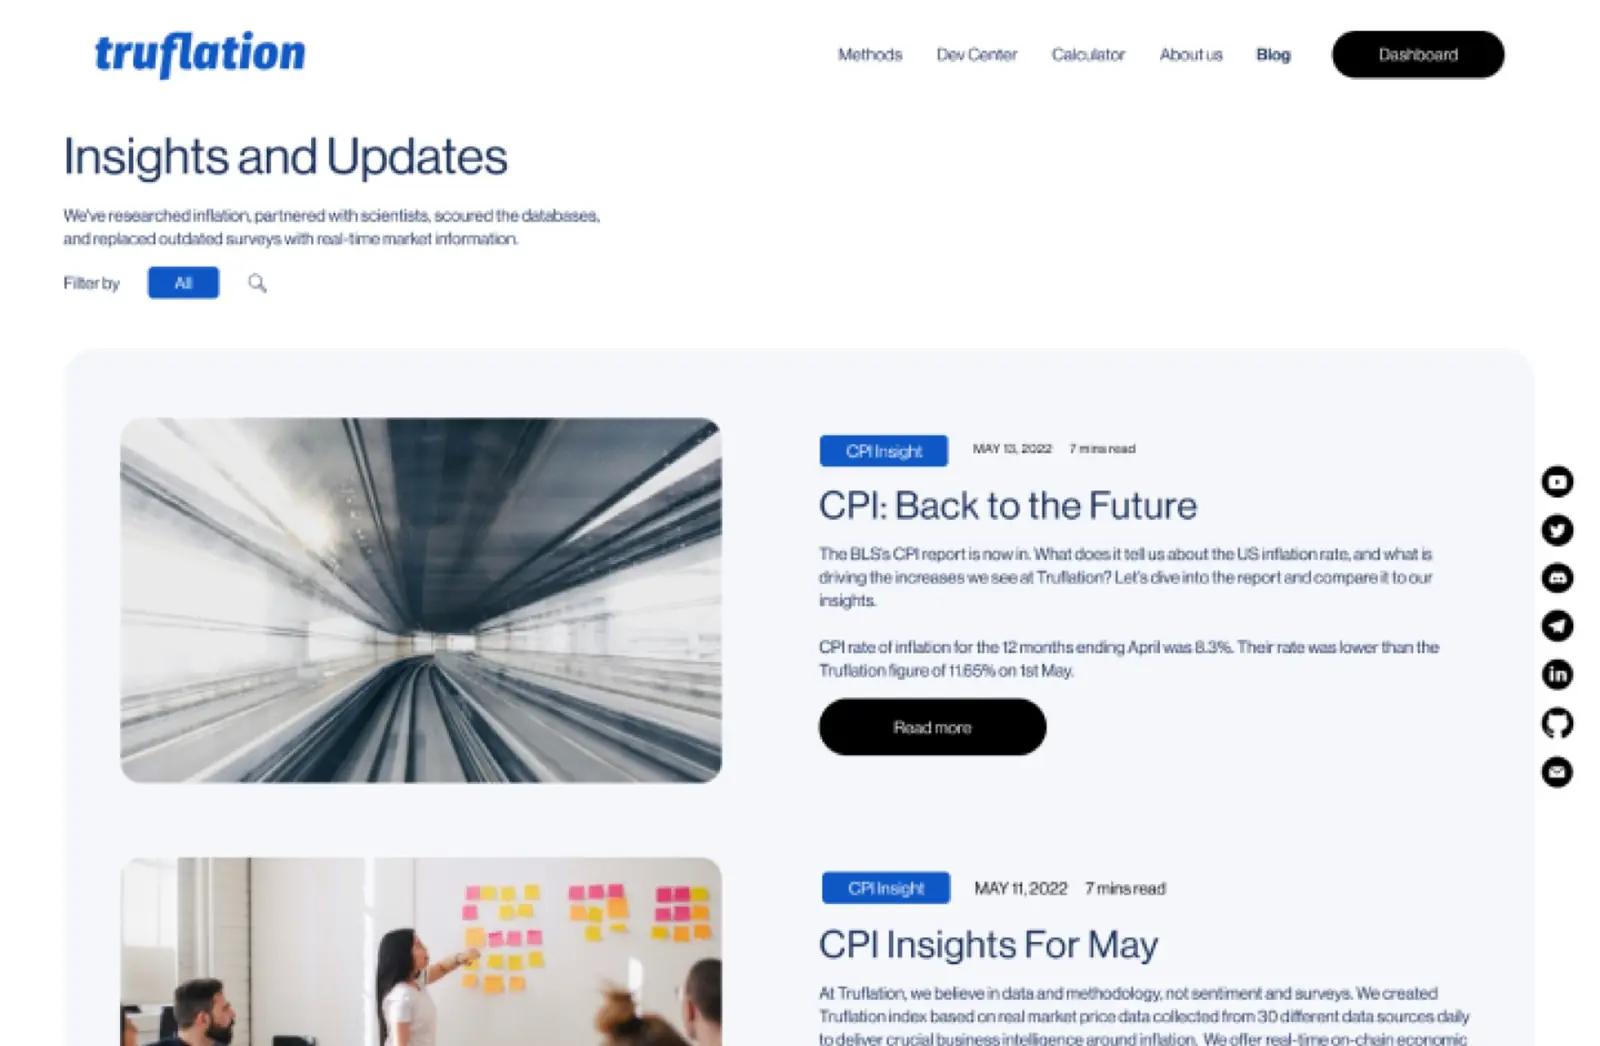
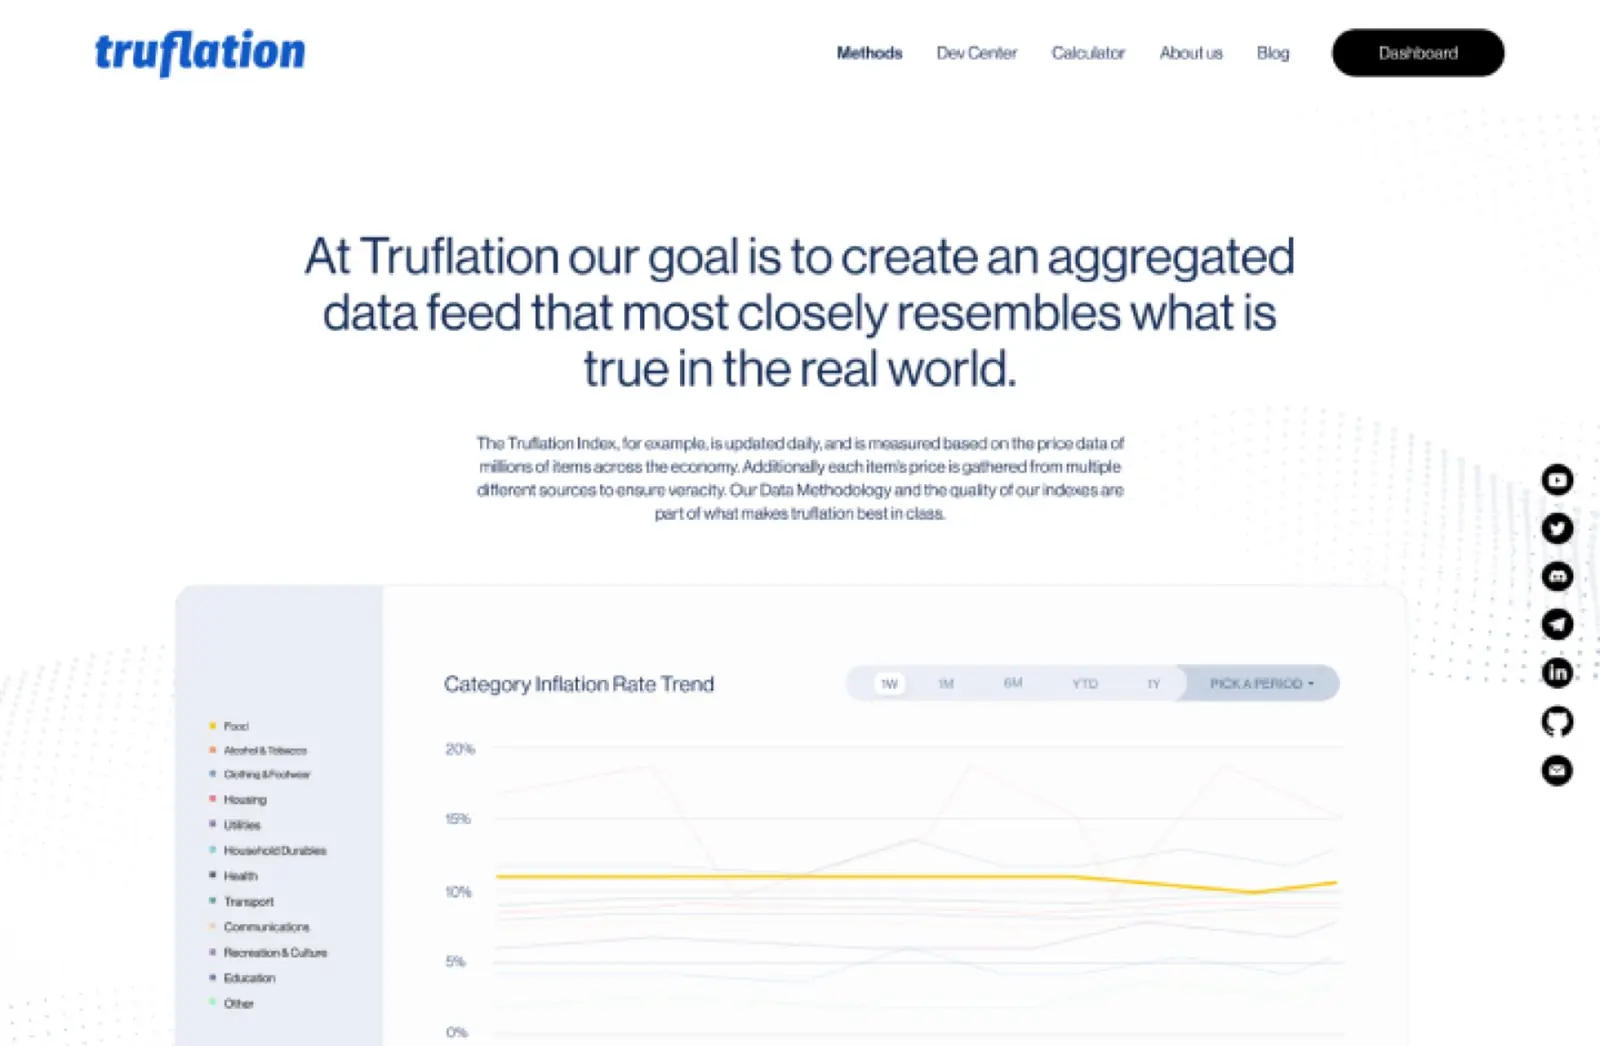
The marketing website, aimed at economists, users and developers who wanted to dig into Truflation's methodology, was built on Craft CMS. Truflation needed plenty of control over content and a framework that would accommodate a custom design. It also published articles in Ghost, so Butter built a feed that pulled approved Ghost articles into the website automatically, keeping the SEO information and images created there. The team could keep writing in the tool it already used.
The dashboard was a separate front end built in Vue and Nuxt, the stack Truflation's own developers already used, with D3.js generating the charts. It combined millions of data points into one interface showing the Truflation rate across the US and UK markets.
Making live data readable
The dashboard had to turn a large, frequently updated dataset into graphs and data views people could read quickly.
Data came through an API, with computation that derived values from the source data to build several graphs and data views. The build was designed to keep API calls to a minimum, reusing the same data across views rather than requesting it again, with one year as the default timescale.
What changed
The website launched in April 2022, and the dashboard went live at app.truflation.com. Butter's previously published analytics for the period after launch recorded 41k new users, a 1,767% rise, 123k views, up 1,039%, and engagement up 31%. The comparison period was not stated, and the figures do not isolate the website from Truflation's wider growth over the same period.
Butter continued to support Truflation after launch. Truflation's website and dashboard have since been redeveloped; this case describes the 2022 launch.
"Butter is vested in our success and that is what makes us want to collaborate even further. Their cutting edge design has given us visibility into our customers and improved the UX that allowed us to unlock our customer acquisition."
— Oliver Rust, Head of Product, Truflation